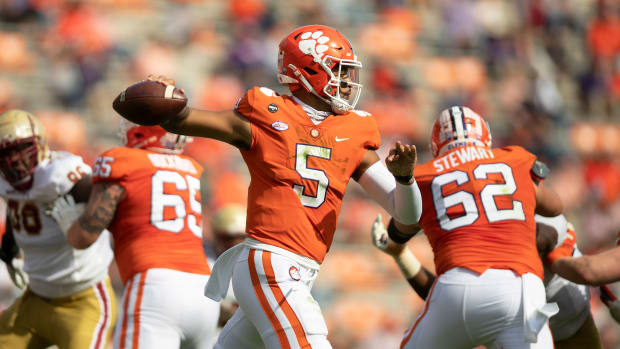
Math is your friend so that's why we're teaming up with it to break the college football betting landscape with a new composite ratings system
I'll level with y'all—I went to journalism school, so I didn't have to do math. I'd never been a particularly strong student where numbers are concerned, so besides the lifelong love of sports and the wish to tell stories, the medium appealed to me because I didn't have to do too much with numbers. And yet, here I sit six years removed from college screwing around with averages and standard deviations and Vlookup tables. Maybe Mrs. Seymour was right after all.

Josh Morgan-USA TODAY NETWORK
The fine folks at Sports Illustrated entrusted me to take a swing at spread picks for every college football game this year. Time will tell if that’s a good decision or not, but let’s have some fun until they wise up. I’m definitely not smart enough to predict every game, but I’m willing to bet (gambling term) that some of the strongest predictive computer models out there are. Using a few, I’ve created a composite power rating to generate my own spreads and see where Vegas’ bias reside.
The secret sauce is simple: Average the ratings from multiple rating systems to get every team's number against the "average" college football team. If Alabama's rating is 10, then they're 10 points better than the average football team. If UConn is -10, they're 10 points worse than the average team and 20 points worse than Alabama. Put 'em on the same field, and the computer says Alabama is a 20-point favorite over the Huskies. So, the composite score listed below for each matchup is the difference between each team.
Watch NCAA football games online all season long with fuboTV:
Start with a 7-day free trial!What follows is simply what the spreadsheet spits out for FBS vs. FBS games. There's no home-field advantage baked in because I don't think home field should be the deciding vote to swing a pick one way or another. And obviously, the spreadsheet doesn't know if the starting quarterback tears his ACL on Wednesday.
I have opinions that often vary from what the numbers say, and that's the human element to making picks. I use this as a base to make my picks, but I've never tested how good the composite is overall, so … here goes.
Season Record
Last Week: 1-3, 25%
Season: 1-3, 25%
Composite Best Bets
DOWNLOAD: PDF or VIEW AS WEBPAGE
Most of the time, the computer spits out something within one or two points of the real line—and at that point, sharp plays and whale plays are what's moving the line anyway. But if the computer gives something three points or more off of the line, it's worth a second look. Here are those plays from this week.
Favorites
-Marshall (-2.5) over Navy
-USC (-14) over San Jose State
Dogs
-Temple (+14) over Rutgers
-Minnesota (+14) over Ohio State
-Oregon State (+7) over Purdue
-Louisville (+11) over Ole Miss
The Big Dogs
-Bowling Green (+35.5) over Tennessee
-ULM (+31) over Kentucky
-Tulane (+31.5) over Oklahoma
-Miami [OH] (+22.5) over Cincinnati
-Miami [FL] (+19.5) over Alabama
-Central Michigan (+14.5) over Missouri
-Akron (+37) over Auburn
-FAU (+23.5) over Florida
-UMass (+38) over Pitt
More from SI Betting:
• Passing Yards Player Prop Betting Projections
• Rushing Yards Player Prop Betting Projections
• Receiving Yards Player Prop Betting Projections
• 2021 Highest-Scoring NFL Team by the Odds: Top-Five Best Bets
• 2022 College Football Playoff Championship Futures Breakdown & Odds
Sports Illustrated may receive compensation for some links to products and services on this website.

Post a Comment
Thanks For Comment We Will Get You Back Soon.